Configuring bubble colors (global & per site)
The visibility map turns your AI visibility data into a single glance: one bubble per tracked location, colored by how strongly your brand shows up in AI answers there. This article explains what drives those colors and who can change them.
What a bubble is
Each bubble on the map represents one tracked location (a city, or a country-level target):
- Position — the location itself.
- Size — how much tracked data sits behind it (number of prompts assigned to that location). Bigger bubble = more prompts.
- Color — the location's aggregated AI visibility score, translated into three bands: green, yellow, red.
- Label — the score as a percentage, so you always see the exact number behind the color.
Clicking a bubble opens its tooltip with the location's score, its prompts, and a Gaps badge when some prompts triggered no AI visibility at all.
How the colors are decided
Two thresholds define the three bands:
| Band | Rule | Meaning |
|---|---|---|
| 🟢 Green | score ≥ green threshold | Strong AI presence |
| 🟡 Yellow | score ≥ yellow threshold (but below green) | Moderate presence — partially visible |
| 🔴 Red | score below the yellow threshold | Weak or missing AI presence — your gaps |
Important: thresholds are a display layer only. Changing them never recalculates a score, never rewrites history, and never re-runs a measurement. The same data is simply grouped into different color bands.
Global defaults (admin)
The platform ships with global default thresholds — currently green ≥ 60% and yellow ≥ 30%. They are maintained centrally in the admin LLM score configuration and apply to every site that has not defined its own values.
Color-threshold changes at global level take effect immediately: reload the map and the bubbles are recolored. No score refresh is required.
Local override (per site)
Any site owner (and admins) can override the thresholds for one specific site:
Settings → Domains → edit your site → "Map & table color thresholds", directly below Brand color & logo.
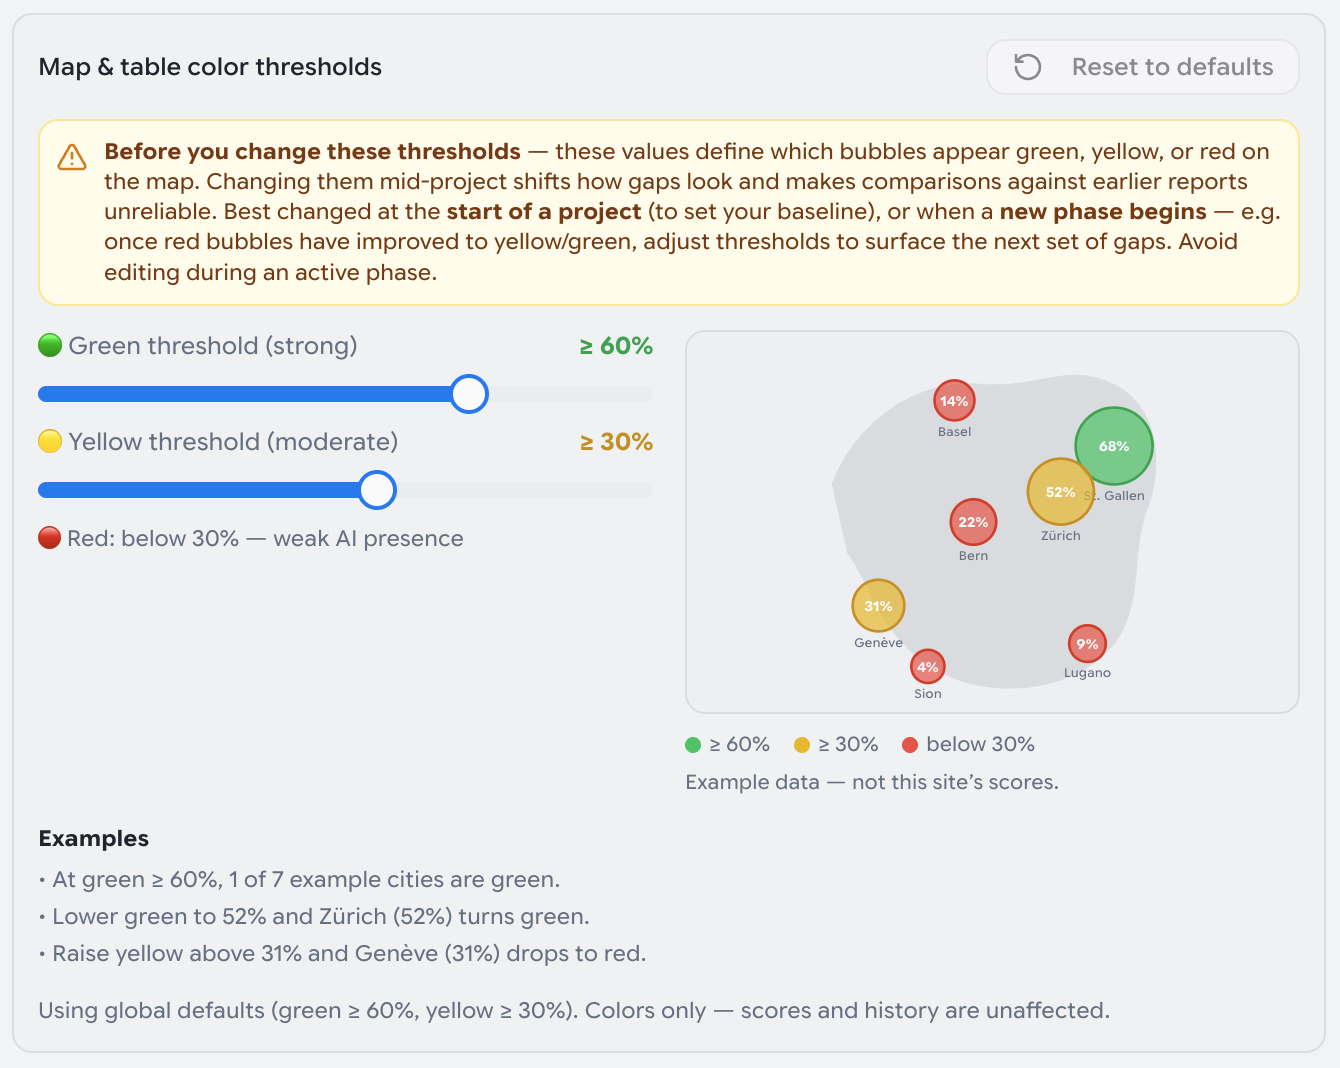
The panel contains:
- A warning notice — a reminder that these values change how gaps look, and that mid-project edits break comparability with earlier reports.
- Green threshold (strong) — the slider that sets where green starts.
- Yellow threshold (moderate) — the slider that sets where yellow starts. Green must always stay above yellow.
- Red hint line — confirms the resulting red band ("Red: below 30% — weak AI presence").
- A live example map — seven sample cities with fixed example scores. Drag a slider and the bubbles recolor instantly, so you can see the effect before it hits your real map. This is illustrative data, not your site's scores.
- Examples — short worked sentences generated from the current slider positions, e.g. "Lower green to 52% and Zürich (52%) turns green."
- Reset to defaults — clears the override so the site follows the global values again.
- Status line — always tells you which mode you are in: "Using global defaults (green ≥ 60%, yellow ≥ 30%)" or "Local override active".
Saving is instant — there is no separate save button and no recalculation step. Refresh the map or table to see the new colors.
Resolution order
For every site, the app resolves thresholds in this order:
site-level override → global admin defaults → built-in fallback
Child domains are independent: an override on a parent site is not inherited, so each child site can carry its own thresholds.
Why this matters for agency accounts
This is where the local override earns its keep. Across a portfolio, "good" is not one number:
- Per-client baselines. A national brand in a competitive vertical may treat 40% as strong, while a local service business should not be called green below 70%. Each client's map can reflect its own bar.
- Per-phase reporting. Set a client's thresholds once at kickoff and every monthly report speaks the same language.
- Honest comparisons. Because a site can look "greener" than another purely because of its thresholds, the panel's status line makes the override visible. When you compare two clients side by side, check whether both are on global defaults.
When to change thresholds — and when not to
Good moments:
- At project start, to establish the baseline everyone will be measured against.
- At the start of a new phase. Once the red bubbles have been worked on and turned yellow or green, tighten the thresholds to surface the next layer of gaps. The map stays useful instead of going all-green.
Avoid:
- Mid-phase edits. Reports, screenshots and exports created before the change use the old bands, so a "red → yellow" improvement can no longer be told apart from a threshold tweak.
- Untracked changes. Note the change (date and new values) in your client documentation, so a later report reviewer understands why the color mix shifted.
Where the thresholds apply
- Visibility map bubbles and their tooltips.
- Competitor overlay bubbles on the map.
- The metric colors in the prompts / metrics table on the site's SEO & GEO page.
- Reports and PDF exports, because they reuse the same map component.
Not affected: stored scores, daily snapshots, history charts, insights and any automation. Those always use the raw numbers.